Introduction
![]()
This project does not contain any source code or files. I just want to make a list of tools to process pcap files in research of network traffic. For more awesome lists, see https://github.com/sindresorhus/awesome
License: CC0 1.0 Universal (CC0 1.0).
Linux commands
-
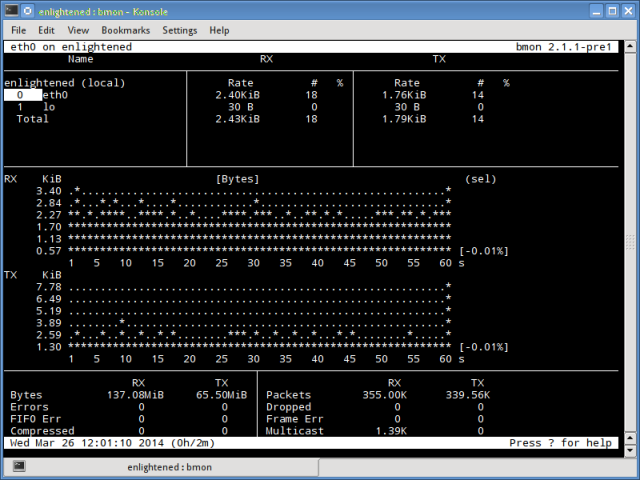
Bmon: (Bandwidth Monitor) is a tool similar to nload that shows the traffic load over all the network interfaces on the system. The output also consists of a graph and a section with packet level details. Screenshot
-
Bwm-ng: (Bandwidth Monitor Next Generation) is another very simple real time network load monitor that reports a summary of the speed at which data is being transferred in and out of all available network interfaces on the system. Screenshot
-
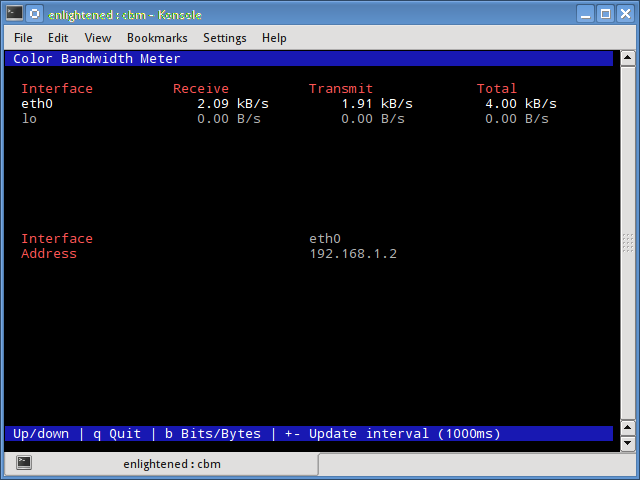
CBM: (Color Bandwidth Meter) A tiny little simple bandwidth monitor that displays the traffic volume through network interfaces. No further options, just the traffic stats are display and updated in realtime. Screenshot
-
Collectl: reports system statistics in a style that is similar to dstat, and like dstat it gathers statistics about various different system resources like cpu, memory, network etc. Over here is a simple example of how to use it to report network usage/bandwidth. Screenshot
-
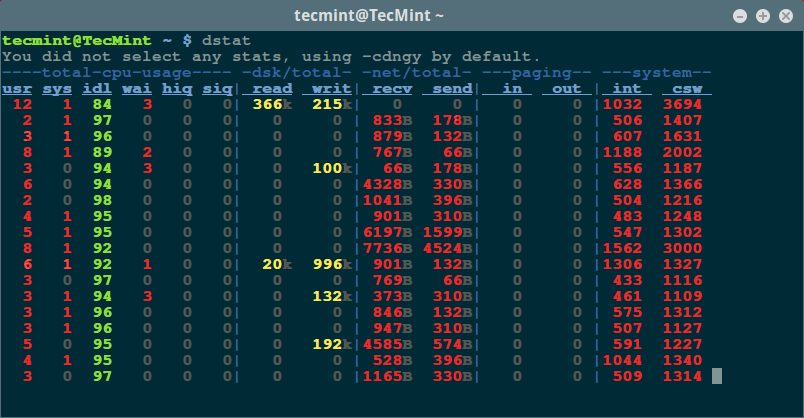
Dstat: is a versatile tool (written in python) that can monitor different system statistics and report them in a batch style mode or log the data to a csv or similar file. This example shows how to use dstat to report network bandwidth Screenshot
-
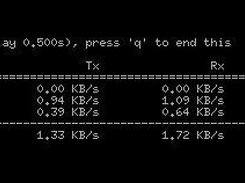
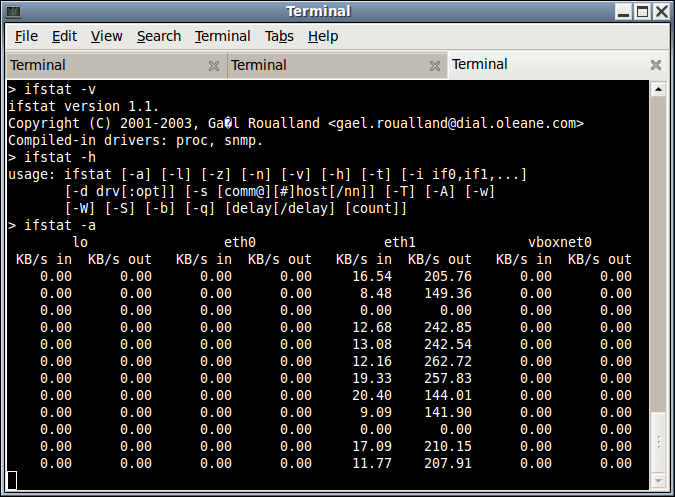
Ifstat: reports the network bandwidth in a batch style mode. The output is in a format that is easy to log and parse using other programs or utilities. Screenshot
-
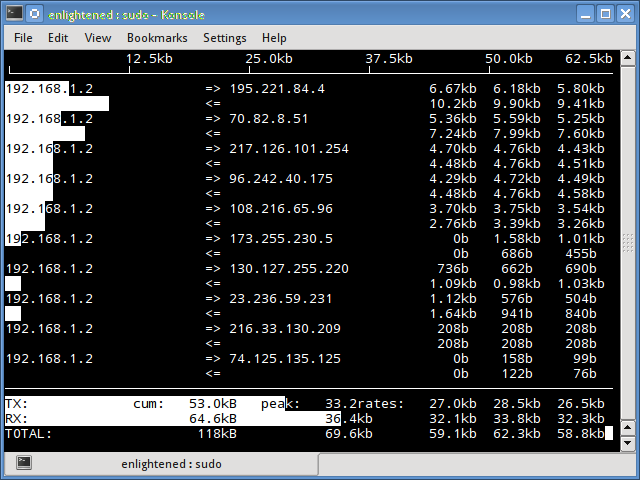
Iftop: measures the data flowing through individual socket connections, and it works in a manner that is different from Nload. Iftop uses the pcap library to capture the packets moving in and out of the network adapter, and then sums up the size and count to find the total bandwidth under use. Although iftop reports the bandwidth used by individual connections, it cannot report the process name/id involved in the particular socket connection. But being based on the pcap library, iftop is able to filter the traffic and report bandwidth usage over selected host connections as specified by the filter. Screenshot
-
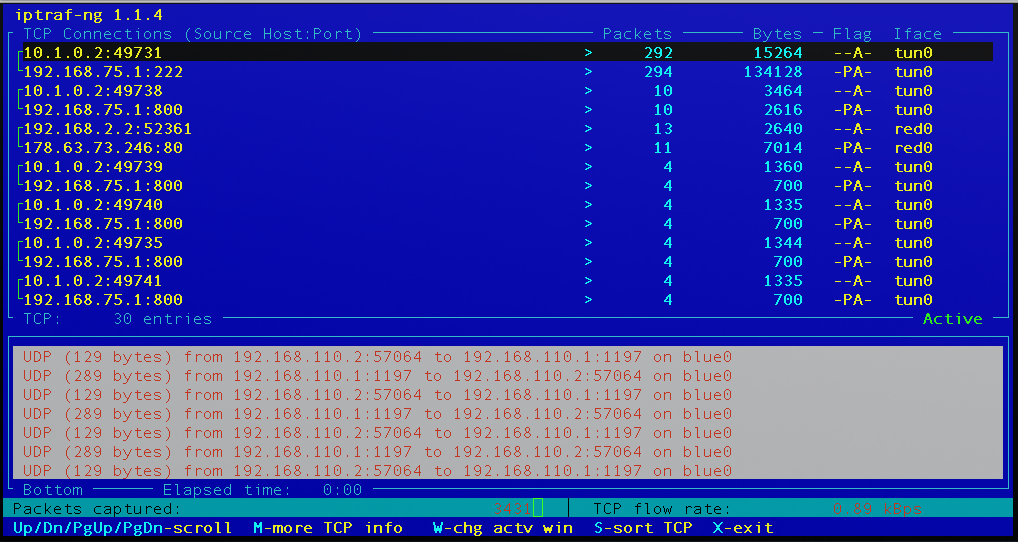
Iptraf-ng: is an interactive and colorful IP Lan monitor. It shows individual connections and the amount of data flowing between the hosts. A maintained fork of the defunct iptraf. Screenshot
-
Jnettop: Jnettop is a traffic visualiser, which captures traffic going through the host it is running from and displays streams sorted by bandwidth they use. Screenshot
-
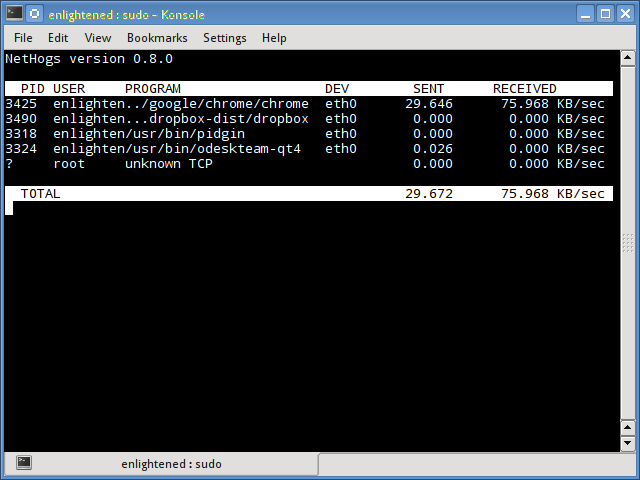
Nethogs: is a small 'net top' tool that shows the bandwidth used by individual processes and sorts the list putting the most intensive processes on top. In the event of a sudden bandwidth spike, quickly open nethogs and find the process responsible. Nethogs reports the PID, user and the path of the program. Screenshot
-
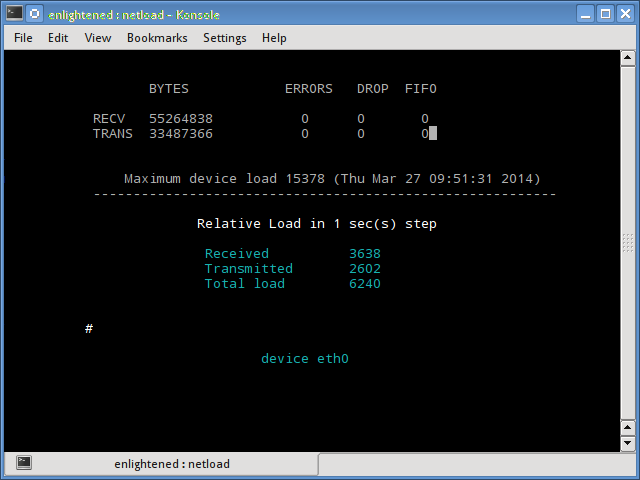
Netload: displays a small report on the current traffic load, and the total number of bytes transferred since the program start. No more features are there. Its part of the netdiag. Screenshot
-
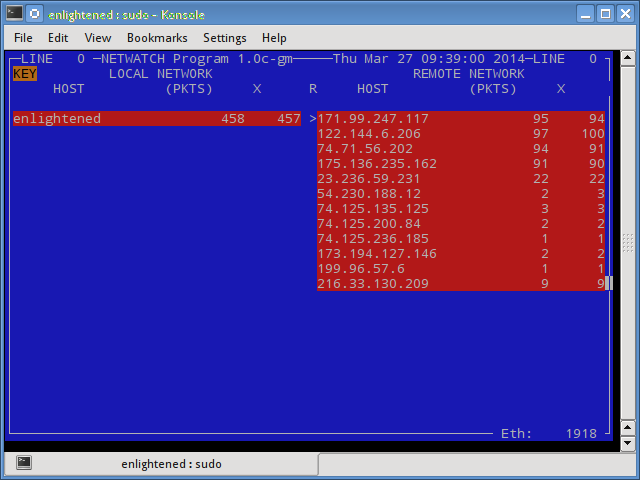
Netwatch: is part of the netdiag collection of tools, and it too displays the connections between local host and other remote hosts, and the speed at which data is transferring on each connection. Screenshot
-
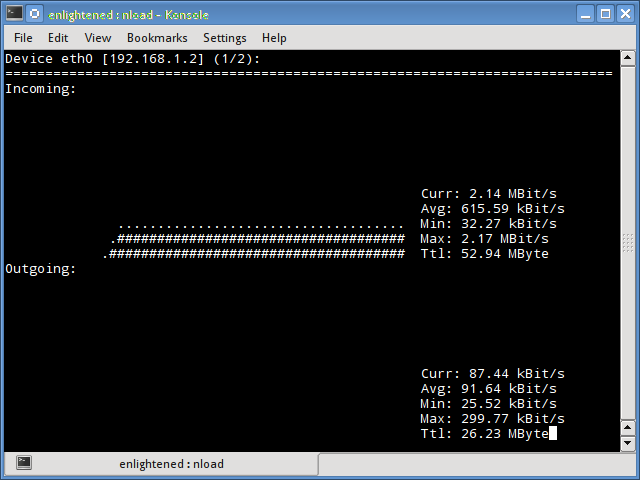
Nload: is a commandline tool that allows users to monitor the incoming and outgoing traffic separately. It also draws outa graph to indicate the same, the scale of which can be adjusted. Easy and simple to use, and does not support many options. Screenshot